The first half of November was a reminder of what market volatility feels like. Disappointing results from several large technology companies and fresh questions about AI spending arrived alongside the midterm elections and continued geopolitical issues. The Nasdaq slipped into correction territory and the Cboe Volatility Index (VIX) jumped sharply[1], and the S&P 500 had its worst week since April 2025[2]. Even so, the S&P 500 was still up nearly 8% for the year as of November 6[3]. Weeks like this are uncomfortable. They are also normal.
Declines happen almost every year
Since 1980, the S&P 500 has fallen an average of 14.2% from high to low at some point during the year, yet it finished higher in 35 of those 46 years[4]. More than half of all years since 1980 have included a double-digit pullback[5]. Last year is a good example, as the index fell 19% during the year and still finished 2025 up 16% on a price basis[4].
Despite average intra-year drops of 14.2%, the S&P 500 finished positive in 35 of 46 years
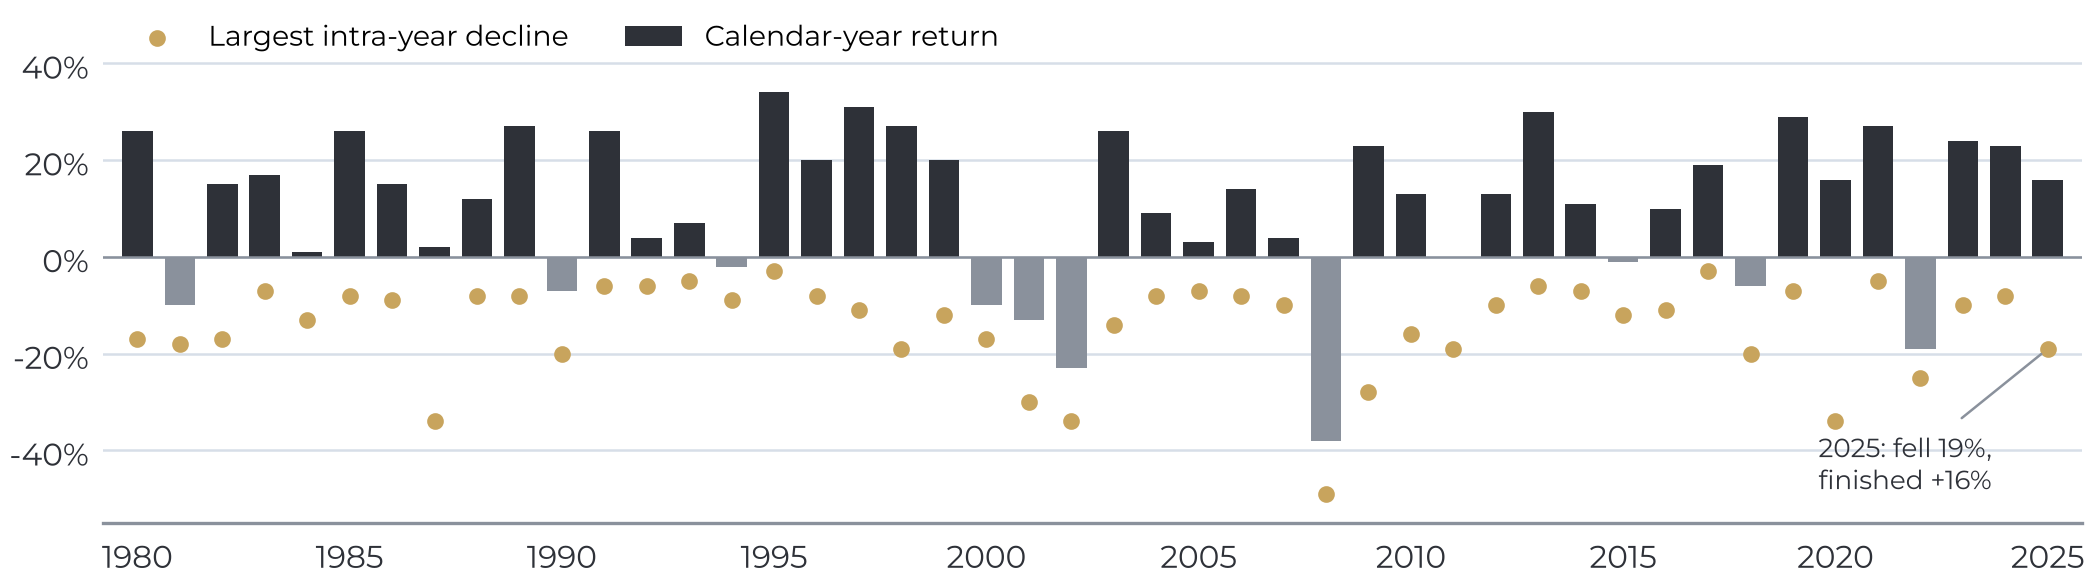
S&P 500 largest peak-to-trough decline within each calendar year vs. calendar-year price return, 1980–2025. Source: J.P. Morgan Asset Management, Guide to the Markets, data as of 9/30/2026 [4].
Midterm years are bumpy, but the 12 months after have been stronger
Historically, the midterm year has produced the weakest average price return (4.6%) and the deepest average drawdown (-17.5%) of the four-year presidential cycle[6]. What followed is notable, as the S&P 500 rose in the 12 months after each of the last 18 midterm elections, back to 1954, with an average gain of 18.2%[6]. Eighteen observations is a small sample, every cycle is different and past patterns may not repeat, so we do not treat this as a forecast. It does show that election-year declines have not, historically, been a lasting obstacle for long-term investors.
Midterm years: deeper average declines; positive 12 months later
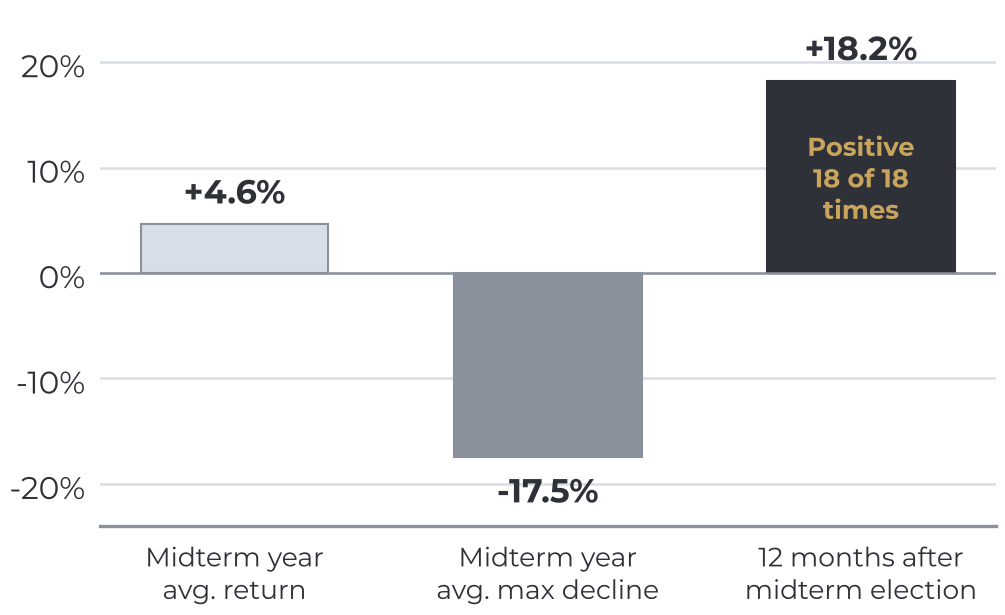
S&P 500 average price returns and average maximum drawdown, 1948–2025; 12 months after midterm elections since 1954. Source: LPL Research [6].
The best days tend to arrive close to the worst
In J.P. Morgan's analysis of the S&P 500 Total Return Index, a hypothetical $10,000 invested from 2006 through 2025 would have grown to $80,619 if left fully invested. Missing just the 10 best days, identified with hindsight, would have cut that to $35,866[7]. Six of the 10 best days came within two weeks of the 10 worst[7]. Because strong days have often come soon after sharp declines, investors who sold during a difficult stretch risked missing the rebound.
Growth of $10,000: staying invested vs. missing best days
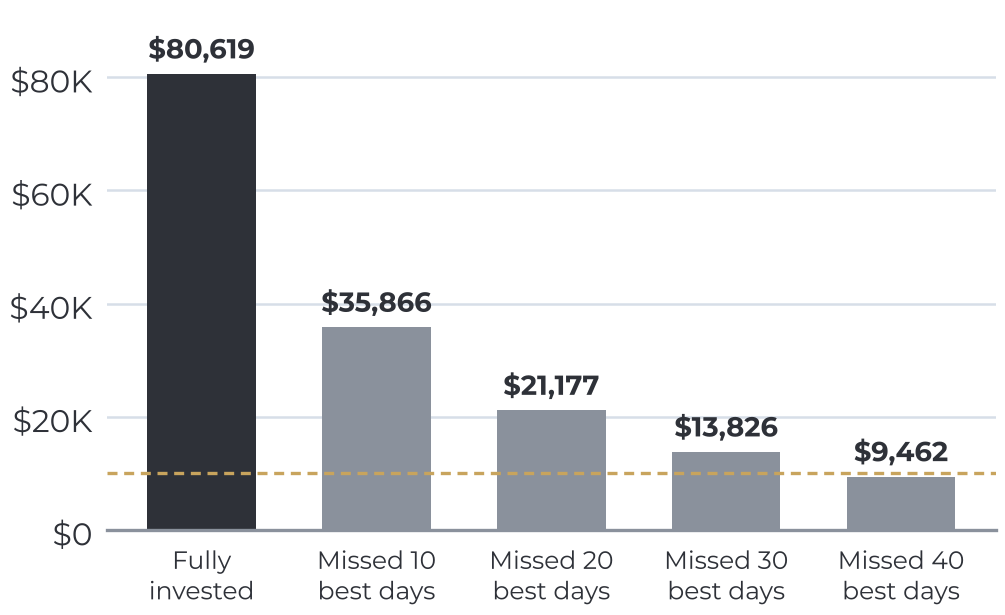
S&P 500 Total Return Index, 1/2/2006–12/31/2025. Dashed line = $10,000 starting value. Source: J.P. Morgan Asset Management, 2026 Guide to Retirement [7].
What we are doing
Our portfolios are built with periods like this in mind. Diversified across asset classes and designed around each client's goals, time horizon and income needs. We are watching markets closely and reviewing positioning as part of our regular rebalancing process. In our view, volatility is a time for discipline rather than a reason to abandon a long-term plan. Staying invested does not eliminate risk, as markets can fall further and recoveries can take time, which is why your allocation should reflect your cash needs and tolerance for risk.
If your goals, cash needs or comfort with risk have changed, that is the right reason to revisit your allocation. Please call us at 410.280.7202. We are always glad to talk.
Sincerely,
Legacy Financial Advisors
Sources
Cboe Global Markets, J.J. Kinahan, “Market Swims in a Sea of Red,” Nov. 5, 2026. Link
TheStreet Pro, N. Sethi, “The Week Ahead: CPI and Equity Flows Test a Shaken Market,” Nov. 8, 2026. Link
Reuters, “Wall St Week Ahead: As tech swoon roils market, US inflation data on tap,” via Khaleej Times, Nov. 2026. Link
J.P. Morgan Asset Management, Guide to the Markets – U.S., “Annual returns and intra-year declines,” data as of Sept. 30, 2026 (S&P 500 price returns, 1980–2025). Link
Calamos Investments, “Significant Intra-Year Drawdowns Are Common,” Volatility Opportunity Guide. Link
LPL Research, “Midterm Elections: Volatility Creates Opportunity” (S&P 500, 1948–2025; post-midterm periods since 1954). Link
J.P. Morgan Asset Management, 2026 Guide to Retirement, “Impact of being out of the market” (S&P 500 Total Return Index, Jan. 2, 2006–Dec. 31, 2025). Link
Important Disclosures
This material is for informational purposes only and is not a recommendation to buy or sell any security, or a forecast of future market performance. Past performance is no guarantee of future results. Indexes are unmanaged, do not reflect fees, expenses or taxes, and cannot be invested in directly. The intra-year decline and midterm charts reflect S&P 500 price returns (excluding dividends); the best-days chart reflects S&P 500 total returns. Historical patterns, including those around elections, may not repeat. Data are from third-party sources believed to be reliable but not independently verified by Legacy Financial Advisors, LLC. Diversification and rebalancing do not ensure a profit or protect against loss in declining markets. All investing involves risk, including the possible loss of principal.